Alberta introduced new royalty formulas in 2009, expecting to collect an additional $2 billion per year in royalties. The result, however, was not what was expected. Instead of collecting an additional $10 billion over the following five years, total royalties collected went down by $13.5 billion. What caused this $23.5 billion difference between expectations and reality? Was it bad luck, bad management, or bad information?
Some say it was bad luck; the government points to the price and claims that nobody can control it. However, the average annual value of production was $83 billion in the five years before 2009 and $82 billion in the five years after; this is not an overall drop in price.
To see why the royalties Alberta collected have been $23.5 billion less than expected, we need to look at the individual formulas. As shown in Table 1, the big change was in gas royalties, which dropped by just over $5 billion per year following the 2009 change. Gas went from providing two-thirds of total royalties to providing only one-sixth of total royalties.
TABLE 1: Average Annual Royalty
In five years before and after introduction of new royalty framework

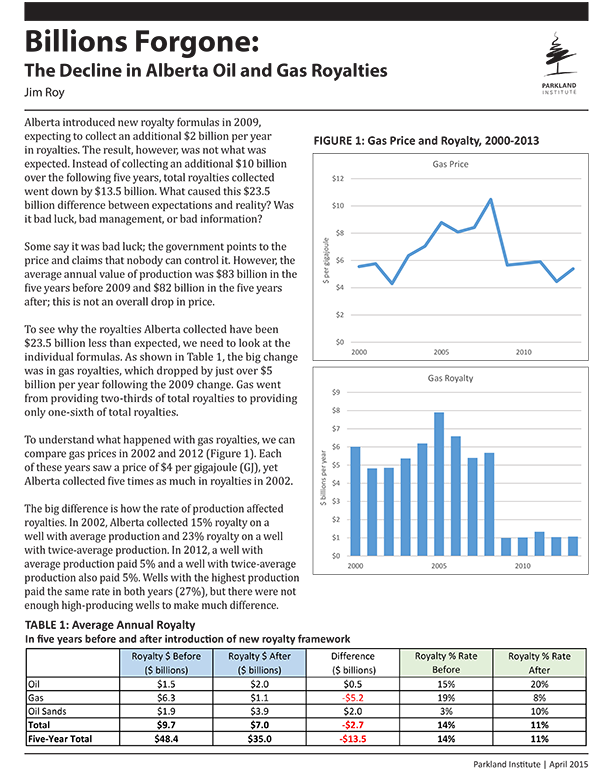
To understand what happened with gas royalties, we can compare gas prices in 2002 and 2012 (Figure 1). Each of these years saw a price of $4 per gigajoule (GJ), yet Alberta collected five times as much in royalties in 2002.
FIGURE 1: Gas Price and Royalty, 2000-2013

The big difference is how the rate of production affected royalties. In 2002, Alberta collected 15% royalty on a well with average production and 23% royalty on a well with twice-average production. In 2012, a well with average production paid 5% and a well with twice-average production also paid 5%. Wells with the highest production paid the same rate in both years (27%), but there were not enough high-producing wells to make much difference.
Another way of expressing the difference is to note that the previous formula started collecting above-minimum royalties when revenue exceeded $5,000 per month, whereas the new formula does not collect above-minimum royalties until revenue exceeds $20,000 per month.
There are other differences, but a full analysis would require access to well-by-well royalty records, and is beyond the scope of this report. Some differences include a gradual drop in total production, an accelerated drop in production per well, and the new-well royalty reduction regulation. Still, there is no doubt that the formula change accounts for more than half of the decline in gas royalties. Alberta could eliminate much of its current budget imbalance simply by reintroducing the previous gas formula.
Shifts in oil and oil sands royalties were not so dramatic. As shown in Figure 2, there was a drop in oil royalty in 2009, due to low price and to a drilling incentive, but increasing price was matched by increasing royalties.
FIGURE 2: Oil Price and Royalty, 2000-2013

Oil sands royalties also increased (Figure 3), but the dramatic change occurred in 2006, and was unrelated to the new formula. The shift was due to five projects achieving payout and switching to the post-payout formula. There was no significant change in 2009 because the new formula was the same as the previous formula at the price in effect. The continued increase in oil sands royalties in recent years is due to (1) increased total volume of production and (2) more projects achieving payout.
FIGURE 3: Oil Sands Price and Royalty, 2000-2013

The fact that nothing significant happened in 2009 does not mean that there are not serious problems with management of the oil sands. Alberta has a low royalty rate compared to rates in countries that have similar quality of resource. Alberta takes from 25% to 40% of profit, equivalent to 10% of gross revenue. Venezuela, which has the most comparable resource, takes 40% of gross revenue – four times as much as Alberta. Saudi Arabia takes 85% of profit and Norway takes 80% of profit – both three times as much as Alberta. Newfoundland/Hibernia takes 30% to 50% of profit plus 7.5% of gross revenue – twice as much as Alberta.
A more serious problem is that Alberta’s failure to manage the pace of oil sands development has not only hurt the Alberta treasury, it has cost Alberta producers. As illustrated in Figure 4, Alberta pushed the Canadian price $25 per barrel below the European price (Brent) or $12 per barrel below the US price (WTI).
FIGURE 4: Oil Prices, US$ Per Barrel

In the five years from 2009–2013, this price differential cost Alberta producers a total of $75 billion (Figure 5).
FIGURE 5: Annual Cost to Producers of Price Differential

It also cost the Alberta treasury $8.4 billion, or $2,024 for each Albertan. The oil sold at low price is gone, the money is lost. The world has given Alberta a clear price signal; Alberta would be foolish to continue increasing bitumen production for sale at such a low price.
Recommendations
1. Increase gas royalty by $2 billion per year
- Repeal the new well incentive as it applies to gas wells
- This follows action in Saskatchewan, which repealed its drilling incentive for gas
- Replace the current production-sensitive royalty formula with the previous low-productivity formula
- The previous Alberta formula continues to be used in British Columbia for coalbed methane
2. Ease downward pressure on the oil price
- Cease bitumen land sales until the Canadian oil price returns to par with the European price
- Pace bitumen land sales so that bitumen production does not exceed Alberta refinery capacity
Notes
1. Annual royalty dollar values extracted from Schedule 1 of Alberta Consolidated Financial Statements. Values from fiscal years adjusted to calendar year basis.
2. Annual prices extracted from CAPP Statistical Handbook as (value of production) divided by (volume of production).
3. Effective annual royalty rates determined as (Value of Crown Royalty from public accounts) divided by (value of Crown production). Value of Crown production taken as Crown share of total provincial value from CAPP Statistical Handbook. Calculated separately for oil, gas, and oil sands.
4. World price in US dollars from the US Energy Information Agency. Comparable Alberta price is Alberta par price for medium, converted to US dollars at exchange rate in New York.
Jim Roy was Senior Advisor for Royalty Policy for Alberta Energy from 1985 to 1993. As president of Delta Royalty Consulting, he currently assists governments obtain value from natural resources. Clients include the governments of Afghanistan, Bolivia, Canada, Kenya, Pakistan, and several Canadian First Nations.
Jim Roy
Jim Roy was Senior Advisor for Royalty Policy for Alberta Energy from 1985 to 1993. As president of Delta Royalty Consulting, he currently assists governments obtain value from natural resources. Clients include the governments of Afghanistan, Bolivia, Canada, Kenya, Pakistan, and several Canadian First Nations.Related reading
Get timely research and analysis from Parkland in your inbox.
Subscribe to email from ParklandYour donation supports research for the common good.
Donate to Parkland Institute